
Projets réalisés
(2003-2016)
The Founding Fathers Network
The Founding Fathers Network is an exploratory pilot project to generate graphic visualisations of the contents of a forthcoming edited volume entitled ‘The Founding Fathers of the Euro: Individuals and Ideas in the History of European Monetary Union’, edited by Kenneth Dyson and Ivo Maes. This book is a project of the British Academy and the European Central Bank, directed by Prof. Kenneth Dyson (British Academy and Cardiff University) and Prof. Ivo Maes (NBB and UCL), which examines key intellectuals who were directly and actively involved in the process of designing a European monetary union that would be sustainable. It looks at their intellectual biographies, the ideas to which they became committed, their network-building skills and their involvement in the very practical issues of monetary integration and union. The principal emphasis is on their individual contributions, their legacies as seen from the vantage point of the euro area crisis, and the prescience and adequacy of their views about the appropriate foundations of EMU. The ten founding fathers of the euro considered are: Robert Marjolin, Robert Triffin, Pierre Werner, Raymond Barre, Roy Jenkins, Hans Tietmeyer, Tommaso Padoa-Schioppa, Karl Otto Pöhl, Alexandre Lamfalussy and Jacques Delors. Elena Danescu will contribute the chapter ‘Pierre Werner — a Visionary European and Consensus Builder’. (The book is due to be published in 2016 by Oxford University Press.)
Our original scope was to use graphic visualisations to provide a bird’s eye perspective on each chapter. In dialogue with the editors, we tested different techniques for the generation of such networks. In order for any such visualisation to be meaningful, we needed to be clear about the underlying data and the meaning of a relationship. Since the book was our only data source, we could not consider other, historically significant relationships which had not been mentioned by the authors.
This original task grew into a benchmarking exercise: which network creation techniques strike the best balance and offer a reasonable representation of the network data contained in the texts with the least effort? This evaluation is ongoing.
Co-occurrence networks
The first approach we took for the Founding Fathers publication was to work with co-occurrences. In our case this means that if two names appear together in the same sentence, they will be related, and in the graph they will be connected by a line. This approach is relatively simple and quick but has a few drawbacks. Consider these sample sentences:
- Pierre Werner and Robert Schuman are both politicians.
- Pierre Werner and Robert Schuman could not stand each other.
- Pierre Werner and Robert Schuman worked together closely.
- Pierre Werner and Robert Schuman had nothing to do with each other.
- He and Robert Schuman decided to go ahead with the idea.
In all cases, the co-occurrence approach will establish a connection between the two names, indicating that they have something to do with each other. The assumption is that if we collect such co-occurrences across many sentences, co-occurring names which have a meaningful relationship of some kind will be connected more closely to each other than those who don’t (sample sentence 4)). We would miss sample sentence 5) since we cannot easily automatically determine who “He” refers to.
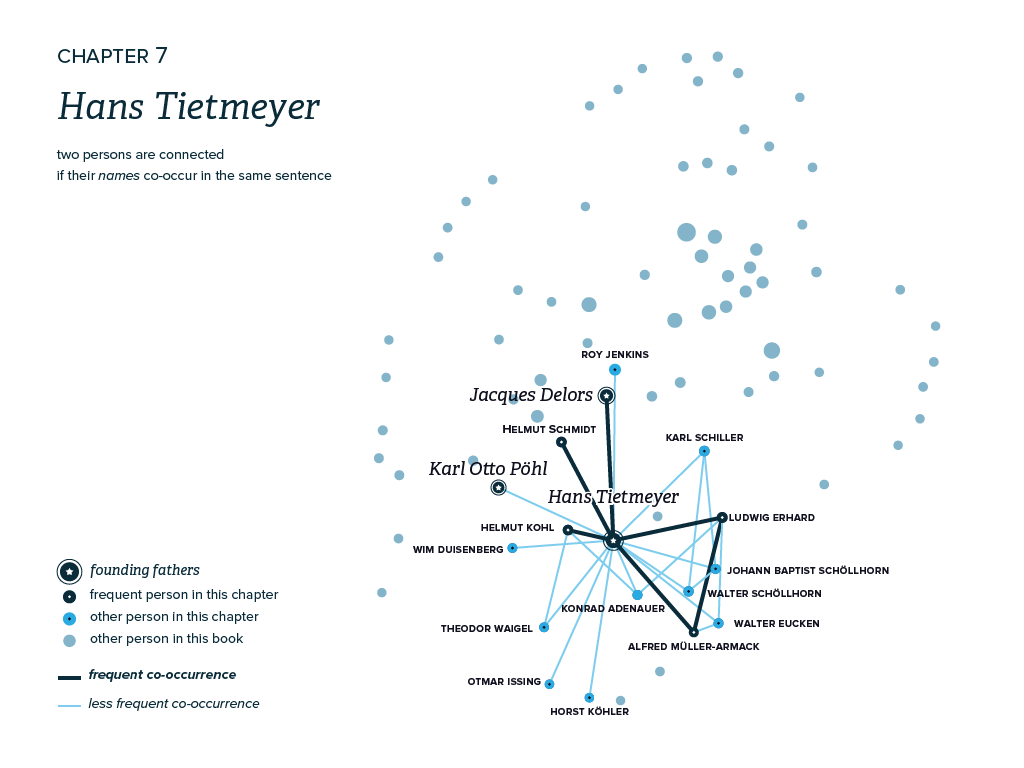
Co-occurrence graph of the chapter on Hans Tietmeyer. Unconnected nodes represent actors mentioned in the other chapters. Visualisation: Daniele Guido.
We first chose this approach for the Founding Fathers in order to produce a rough representation of each chapter. Such a graph could show who, according to the author, was likely to have had something to do with whom — no more or less. It could give readers a sense of who the main characters are and who co-occurred with whom within a specific chapter. This representation depends heavily on the choices of the author and his or her writing style. In general we need to distinguish between a representation or illustration of the historical complexity itself (see below) and a representation of the contents of a book which describes it. The co-occurrence network approach is suited to providing an idea of the chapter contents and thereby also indirectly of the historical relations between the founding fathers.
Manually encoded illustration
For our second approach, Elena Danescu encoded relations between the founding fathers based on her expertise as a historian. She tried to balance the complexity of social relations and abstracted them as much as possible: an edge between two people could have three values: (1) no relationship, (2) a weak relationship and (3) a strong relationship. While we may be able to spontaneously say that Person A and Person B ‘were close’, this becomes difficult once we try to compare two pairs of people: are they both close? Is one pair closer than the other? It is therefore important to justify what counts as a relationship and what does not: a network which shows personal appreciation among the founding fathers could look very different from a network of the frequency of their correspondence. Things become very difficult once e.g. formal and informal relationships are both represented in such a graph: it will become obscure to viewers what exactly they are seeing. Once it has been decided which group of actors and which type of relationship is of most interest, the data can quickly be collected manually and a network can be visualised. See the Werner Committee Network as an example of what such a coding scheme can look like. The focus of the Founding Fathers Network was on illustration rather than on exploration or analysis. Still, despite its shortcomings, the three graphs provide a rough idea of who interacted with whom.
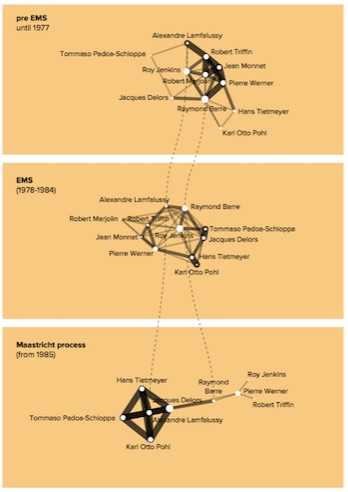
Change over time in the freely compiled network data set. Visualisation: Daniele Guido.
This visualisation is a representation of Elena’s expertise in the field and her interpretation of social relations between the main actors. Her judgment is based on her rich experience and necessarily has to balance many different factors. While this representation does a good job of conveying a rough idea of the relations between the chosen founding fathers, viewers will struggle to understand her reasoning.
Manually encoded network
Finally, we settled on a third approach: we moved towards a closer definition of relationships as direct interactions between people (sending a letter, meeting in person, etc.). The chapters of the edited volume remain the underlying data set. This results in a network which represents all descriptions of direct interactions in the book. This is based on the rationale that (1) the most important interactions were selected by the author and (2) direct interactions can be viewed as representations of historically significant social relationships. This data set is still in preparation.
Future work
Our collaborative work on this pilot project provided us and the editors with a better sense of what to expect from graphic visualisations as well as their strengths and weaknesses. The three graphs are all different representations of the same data set and their detailed comparison will offer new insights into the biases inherent in each of the three extraction methods.
Project team
Dr Elena Danescu
Dr Marten Düring
Daniele Guido